 |
| Technical and Fundamental, which would you choose?
Wordbnd.com - Buying a stock is like buying a business, an investor needs to conduct a feasibility study or analysis so that the risk of uncertainty is reduced and protected from losses.
There are two analyzes used by investors in investing in stocks, namely fundamental and technical analysis. Both analyzes are equally good and can be used together to choose the best stock.
Fundamental Analysis
Fundamental Analysis is an analysis that considers things that can drive stock prices, including financial performance, level of business competition, industrial potential, market analysis and macro and micro economics.
Conducting fundamental analysis is usually used to answer:
Is the company still healthy or not?
At what price is a stock worthy of respect?
In the short term the price of a stock can fluctuate or even go down, but in the long run the stock price with good fundamentals will tend to move up.
In general there are two approaches used in analyzing a stock fundamentally, namely the Top-Down Approach and Bottom-Up Approach. Both approaches have the same goal, which is to find superior stocks that are worthy of collection.
Top-Down Approach

A fundamentalist or fundamentalist analyst who uses this approach assumes that when all things support, then the price of a stock will be impacted up.
Like farming on a land, favorable weather, accompanied by sufficient water, plus fertile soil, and farmers using superior seeds, predictably the harvest will be abundant.
According to Fundsupermart there are four things in a top-down approach, starting with:
1. Global macro conditions
2. Domestic macro conditions
3. Sector growth prospects
4. Fundamentals of the company.
An investor needs to analyze macroeconomic variables both globally and domestically that can affect company performance. Based on the analysis, investors then choose which sector or industry has the best prospects.
After that, investors re-analyze which issuers are best for investing. As a result, superior stocks will be selected as their stock portfolios.
As for some components that need to be considered in the analysis using a top-down approach:
- Global macro: economic growth projects, conditions of relations between countries / geopolitics, political conditions.
- Macro domestic: general economic conditions, economic growth / GDP growth, inflation rates, central bank interest rates, socio-political developments.
- Sector: sector growth prospects, industrial cycles.
- Company: analyze the company qualitatively (explore all matters related to the company's business, including its management), Analyze the company qualitatively (to find out the financial health of the company).
Bottom-Up Approach

Unlike the top-down approach, the bottom-up approach overrides economic analysis and market cycles. The bottom-up approach only focuses on analyzing each stock.
Through this approach, investors do not focus their attention on the condition of the economy as a whole or certain industries, but rather one by one issuer.
Read too:
Four Tips for Choosing the Best Mutual Funds
The bottom-up approach rests on the assumption that the issuer can perform well even though the industry is declining (sunset).
This approach requires investors to conduct an in-depth study of the issuer, including the issuer's products and services, financial stability and aspects that can impact on the issuer's performance.
Learn also the competitiveness of issuers in the market, the level of debt and cash owned, patterns of dividend distribution within a certain time, the company's profits from time to time.
Technical Analysis
Technical analysis is used to predict future stock price trends, mainly through the use of charts. The person is usually called a chartist. Even though it cannot predict future price movements in absolute terms, this analysis can help anticipate what might happen to future stock prices.
For novice investors, technical analysis is usually easier to learn than fundamental analysis because it only requires reading charts. In addition, investors must have patience and discipline (sadistic).
Get to know the chart
In technical analysis, there are three types of graphs that are most widely used, namely line charts, bar charts and candlesticks.
The line type chart shows the closing price of the trade every day or at the end of each time period.
|

Bar charts are formed based on four components abbreviated as OHLC, namely the opening price (Open), the highest price (High), the lowest price (Low), and the closing price (close).
Here's an example of a Bar Chart:

The candle type chart consists of all four bar graph components, only accompanied by color. The dark color on one candle is a sign that a stock is down while the bright color is a sign of an increase.
Here's an example of a candlestick type chart:

Knowing the Characteristics of Stock Price Movements In outline there are three types of movements that exist in the market according to Charles Dow, namely primary movement movements, secondary movement movements, and daily fluctuations (daily fluctuations).
Some capital market articles noted, Charles Dow is a journalist, owner and editor of a media called The Wall Street Journal in the US. Together with Edward Jones, he made the Dow Jones Industrial Average (DJIA) which is the oldest stock index in the US.
Dow theory can facilitate investors in identifying the direction of movement of a stock based on identification of the main trends, and based on stocks whose main trend is rising to invest.
Primary Movement
In a primary trend, the market usually moves up (bullish) or down (bearish). The direction of the main trend has a tendency to continue until there are signals that indicate a reversal.
Secondary Movements
Literally, secondary trends are reactionary or counter to primary trends. For example in a bullish market, a secondary movement is considered as a correction.
Foto: yazid
|
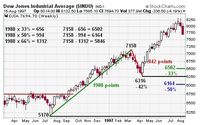 Foto: yazid
At the end of March-97, the Dow Jones index has decreased for 3 weeks indicated by a red line. The movement can be said as a secondary trend movement (Secondary movement) as a correction for the Primary Movement.
Daily Fluctuations
Stock price fluctuations that occur on a daily basis are important if seen as a single entity, too focused on fluctuations in stock prices every day will cause wrong in estimating stock prices and the potential for loss. It is important to look at the whole picture when analyzing daily price movements. Like puzzle pieces, some parts will have no meaning, but they are also very important to complete an image.
Daily price movements become important when combined with other days to form patterns in an analysis.